Overview
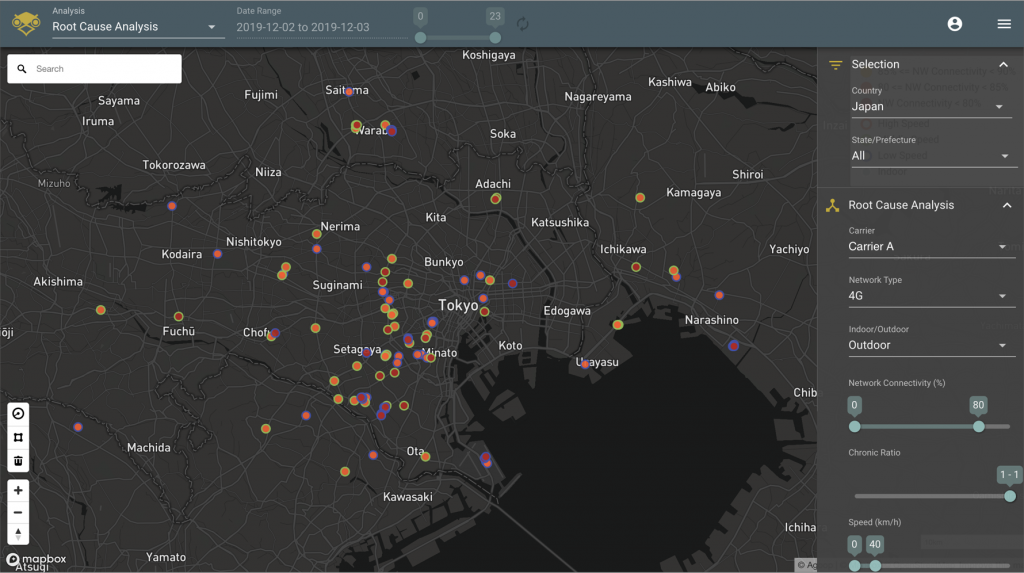
Pin-point network anomaly detection
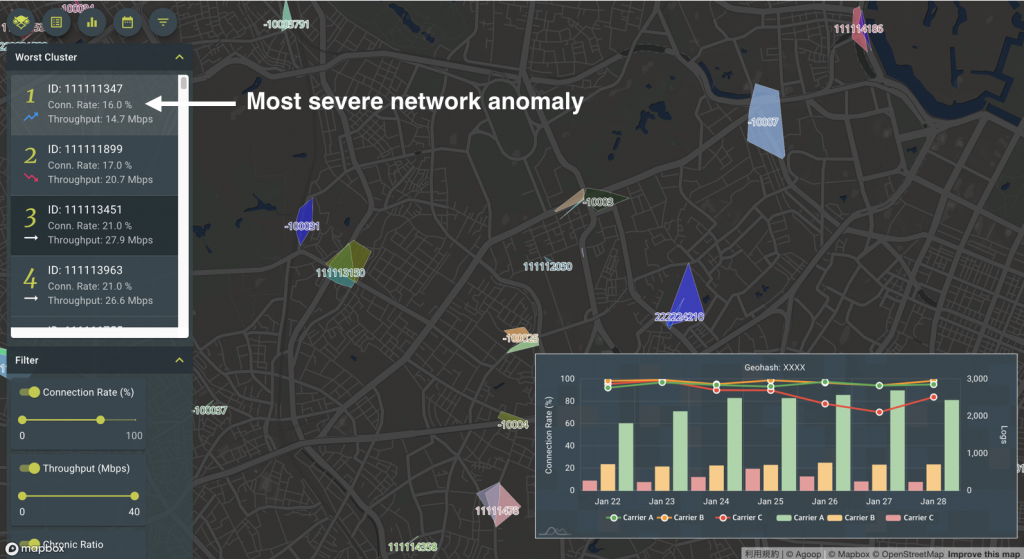
Automatic prioritization of anomalies
What differentiates us from others is our deep experience of network optimization at SoftBank Corp in Japan, as well as Sprint Corp in the USA.
We aim to enrich societies by helping to improve network accessibility across the globe, by automated algorithms, and delivering it to you on a beautiful, modern and easy-to-use dashboard. The main indicators we use are the followings:
1. Network connection rate
2. Throughput (up & down)
3. Number of people in the area
4. RF (RSRQ, RSSI, RSSNR, etc)
5. And more
Problem we are solving
Today, many carriers are suffering from lack of data, knowledge and resource to analyze mobile networks. RF data bought from data providers can be very noisy, field definitions vague and complex, making it hard to utilize without prior experience. Data from BTS has low resolution as it’s not based on user’s device side measurements, is restricted to connected devices (i.e. can’t detect non-connected devices), and competitor analysis is not possible. While driving tests can give you deep insights, it is very expensive and highly labor-intensive; thus cost-inefficient and slow. Driving tests can’t get you measurements of your competitors either, therefore, hard to make prioritization of areas to optimize, ultimately leading to lower user-satisfactions and churns.
Our solution
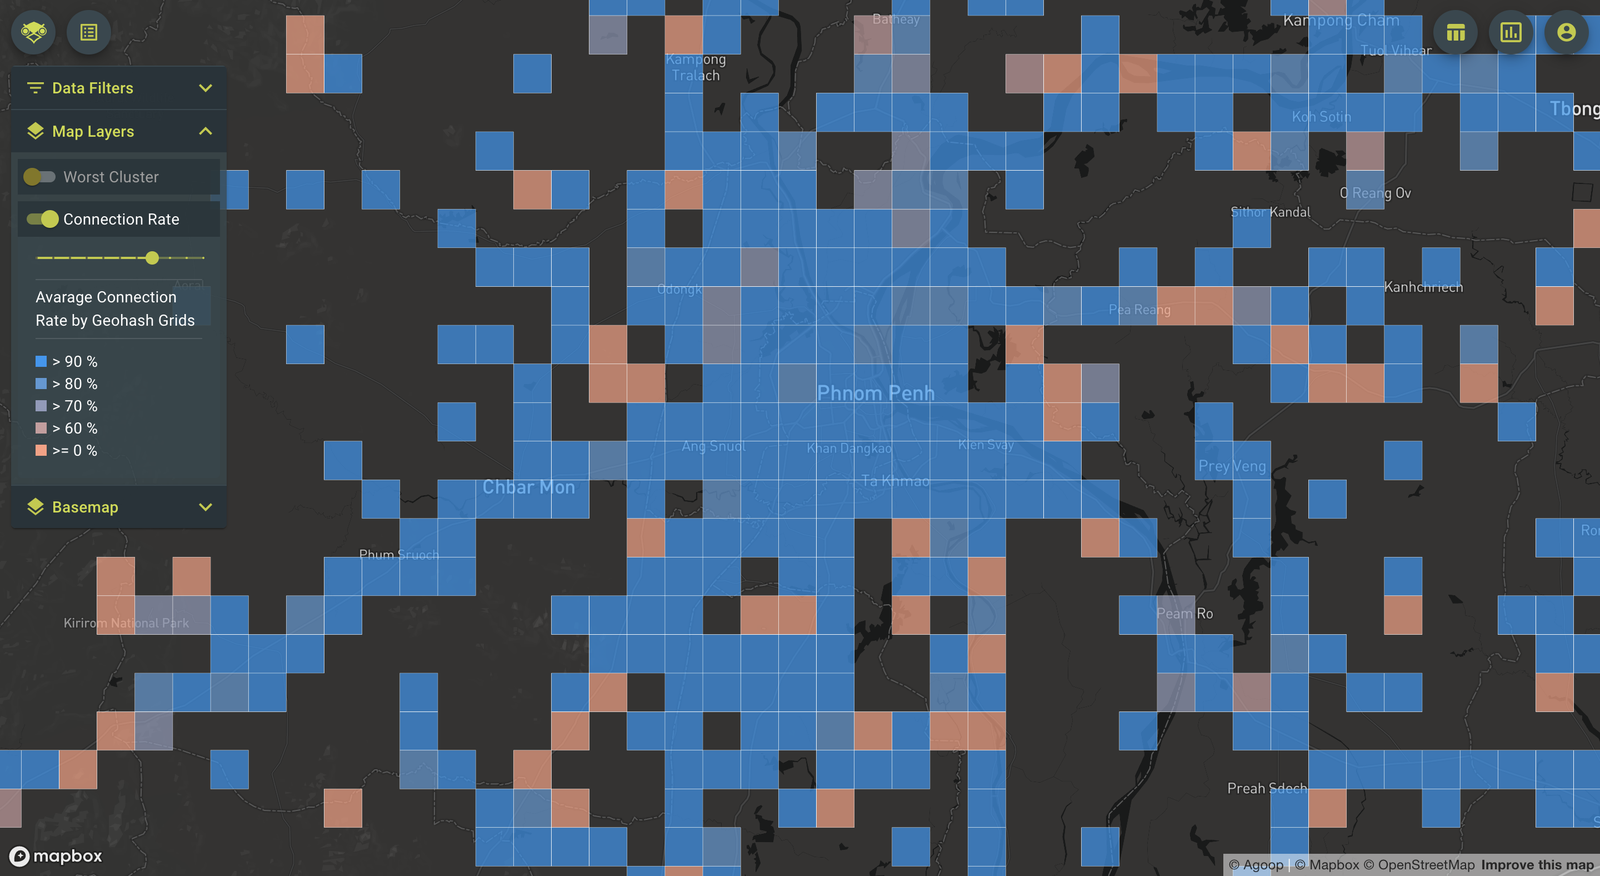
1.Real-time visualization of network quality
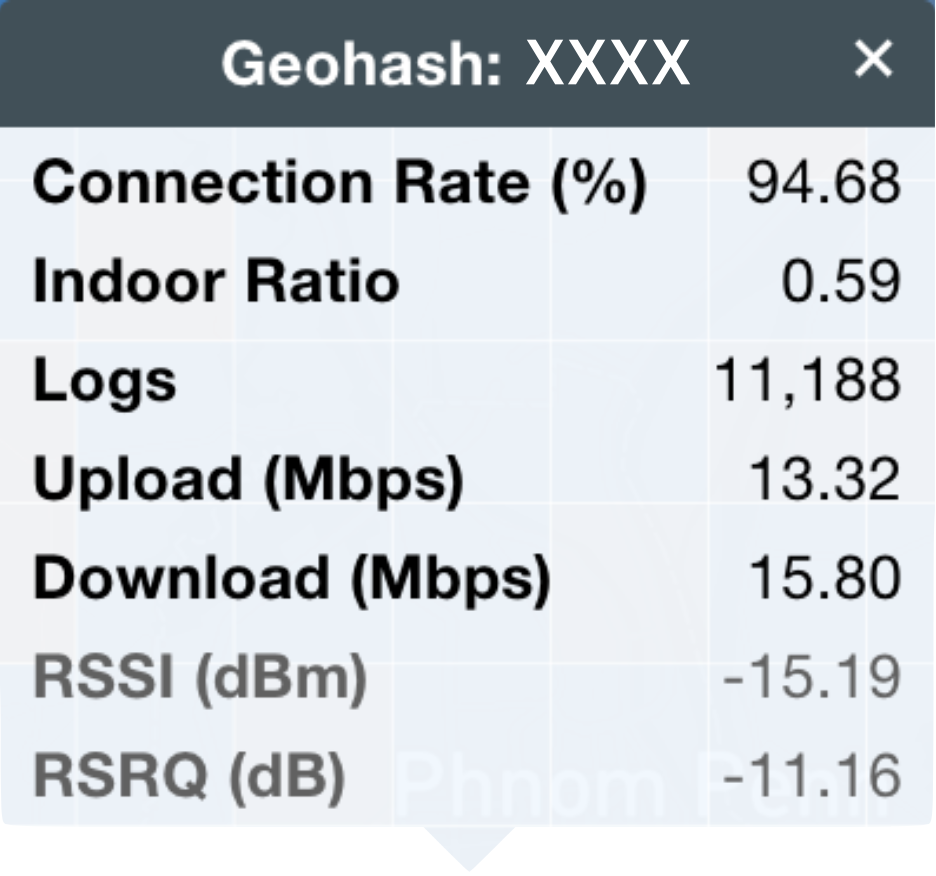
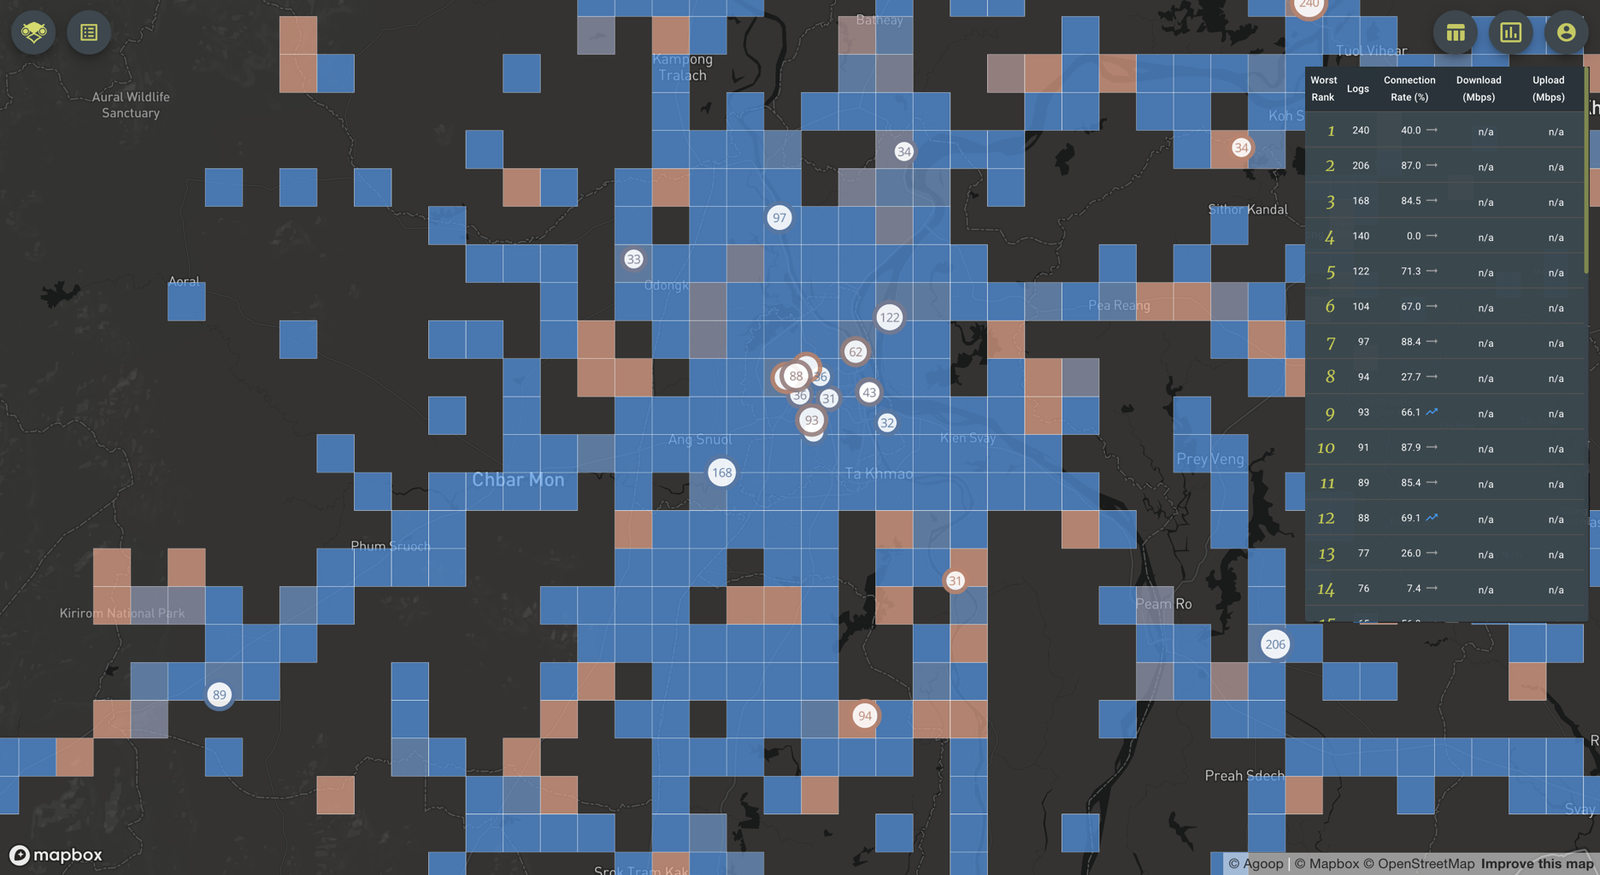
The left picture is a popup showing aggregated details of the clicked box. From this we can see the connection rate, upload and download throughput, indoor ratio of the devices, as well as RF information.
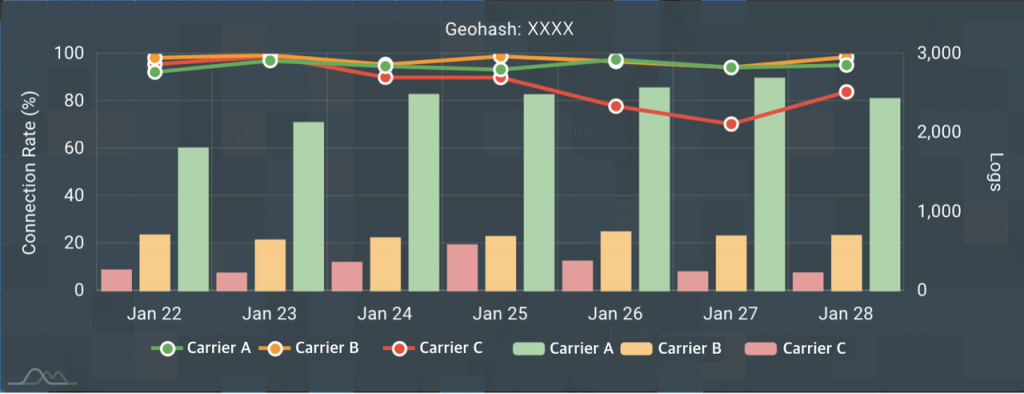
The picture on the right shows the time-series trend of connection rates within the region of the clicked box. The line-plots are connection rates of each carrier (i.e. A, B and C), while the bar plots are their log volume. On this graph, values are aggregated by date for simplicity, however, it can be changed to any resolution based on your needs (i.e. per hour, minute, week, month, etc).
2.Anomaly detection & prioritization using machine learning
Contact
For more details, contact us now at:
mnea@agoop-business-support.zendesk.com